In this blog I take a look at the latest trends in startup funding across different sectors in March.
I’ll use those trends to give you the inside scoop on the strategies employed by Prelo customers to consistently find decision makers in Startup.
If you’re wondering where all of the Startup investment went in March, continue reading. 👇
The information from this blog will help you set up your Prelo dashboard for maximum conversion.
Before you dive in, here’s a short blog I put together last year about key funding stages in Startup.

March Madness: 22 Industries Getting the Most Startup Funding
Now, let’s dive into the data and uncover the top sectors that received the most investment in March.
As mentioned earlier, this blog will help to hyper-focus your outreach strategy for targeting funded Startups.
Top Industries with the Highest Investments in Startups
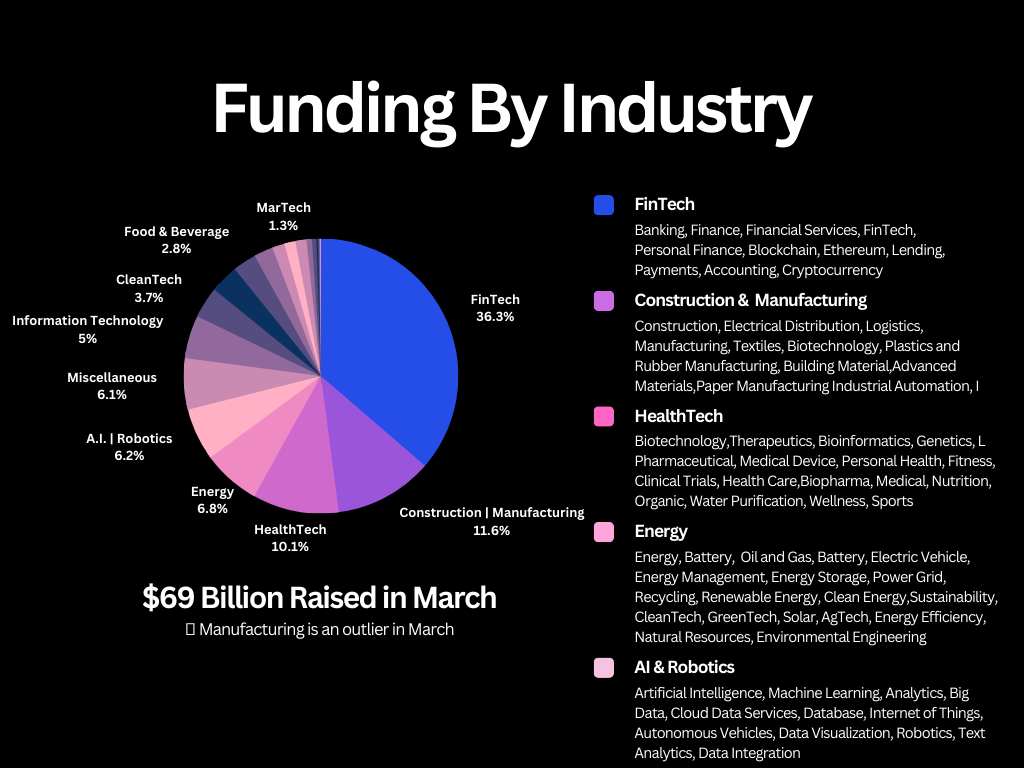
March was a relatively busy month for investments, with a total of $69bn raised, we had 22 industries to pick from. Below we’re going to cover just 5 of the top industries in May.
- Fintech
- Construction & Manufacturing
- HealthTech
- Energy
- AI & Robotics
I shared the top 5 industries in the newsletter, it’s time to discover the 22 industries that attracted Startup funding in March!
| Industry | ($) Total Raised |
| FinTech | $25,250,333,507 |
| Construction | Manufacturing | $8,057,654,865 |
| HealthTech | $7,050,694,525 |
| Energy | $4,749,270,292 |
| A.I. | Robotics | $4,277,764,882 |
| Miscellaneous | $4,209,116,576 |
| Information Technology | $3,507,811,012 |
| CleanTech | $2,568,166,594 |
| E-commerce | Consumer | $2,324,823,202 |
| Food & Beverage | $1,944,369,282 |
| PropTech | $1,569,783,905 |
| Travel | Tourism | $1,011,315,598 |
| MarTech | $907,810,234 |
| Transportation | Logistics | $903,609,234 |
| SaaS | $441,665,146 |
| EdTech | $367,797,920 |
| Gaming | $136,905,261 |
| Sales | Automation | $94,057,315 |
| Industrial | $50,369,844 |
| Blockchain | $44,509,785 |
| Venture Capital | $25,744,905 |
| InsurTech | $19,126,064 |
| Total | $69,512,699,948 |
Table 1.0 – Top Industries that raised the most Startup Funding in March
Picking Top Performers and Managing Funding Outliers
As you can see, the FinTech industry alone attracted $25.2bn in investments. This highlights the consistency we’ve seen in FinTech over the past 18 months.
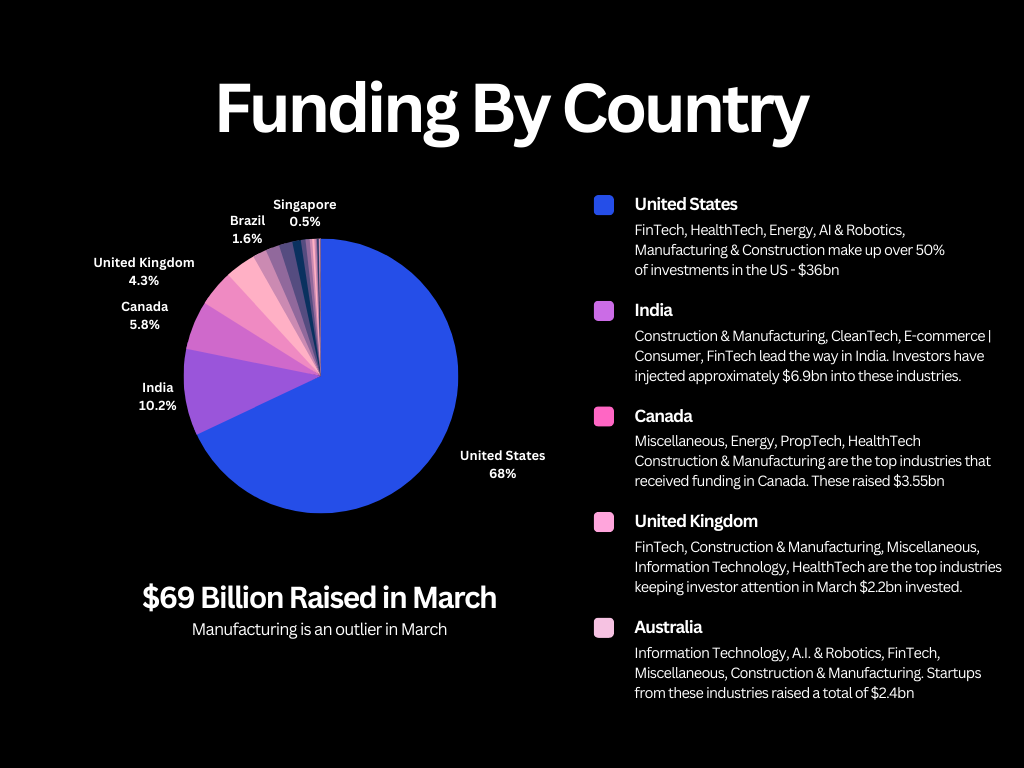
The UK and the US were the biggest beneficiaries in Fintech, with the UK & US raising $0.87bn and $22.5bn in Startup Funding respectively.
The Construction and Manufacturing industry came second, with just over $8.0bn worth of funding raised by Startups in this sector.
India completely dominated this industry, receiving a total of $5.06bn in investments. Worth mentioning at this point that Startup funding of $5bn was raised by a single company in India.
The Biggest Winners in the Startup Funding World
Now that you know top industries that raised the highest startup funding in March, let’s segment them by location and look at their funding updates by Countries and Cities.
Top 9 Cities with the Highest Startup Funding in March
I get it, United States is a clear leader in the Startup funding market, but there are other countries making significant gains.
India, Canada, the UK, and Australia were the big winners involved in Startup funding madness in March.
It’s worth noting that, over the past 24 months, Prelo’s data has shown that San Francisco is perhaps one of the most investible cities in the world.
This March, we’re adding Charlotte, Surat, New York and London to the top cities that received the most Startup Funding.
| Country | City | ($) Total Raised |
| United States | Charlotte | $12,983,930,902 |
| United States | South San Francisco | $6,510,000,000 |
| India | Surat | $5,000,000,000 |
| United States | New York | $2,088,996,248 |
| United Kingdom | London | $1,884,121,684 |
| United States | San Francisco | $1,828,240,531 |
| Australia | Sydney | $1,813,480,616 |
| United States | Los Angeles | $1,592,592,495 |
| Canada | Saskatoon | $1,503,981,062 |
| United States | Houston | $1,238,076,104 |
Table 2.0 – Top Cities that raised the most Startup Funding in March
What Does This All Mean for Prelo Customers?
The insights from March‘s Startup investments provide Prelo customers with a unique opportunity to understand the trends, industries and countries that are attracting investor attention.
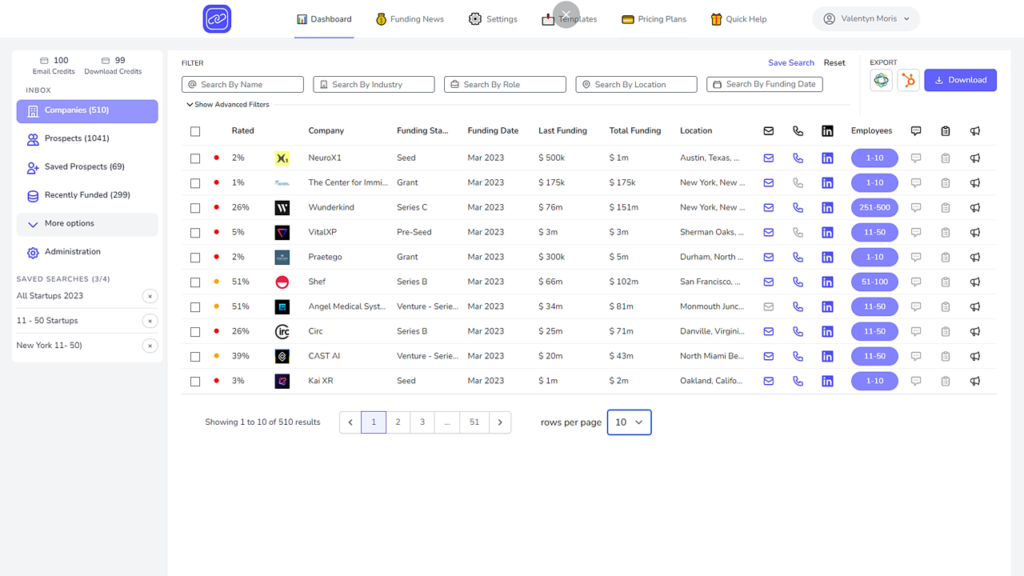
By understanding these trends, customers can setup their Prelo dashboard and create a scalable process to consistently target decision makers from well–funded Startups.
Furthermore, customers can use the data to gain insight into the Startup funding market, using the knowledge to build a highly qualified list of prospects in the Startup world.
There is no better opportunity to use monthly funding data to gain insight into emerging Startups world wide.
April Strategy: Setting Up Your Prelo Dashboard to Unlock Success
Q1 is done, and as we move into the second quarter, you need a solid strategy for your targeted outreach with Prelo.
With all the Startup funding information and insights I’ve shared above, you need to optimize your Prelo industry settings to boost your Q2 outreach.
How to Configure Your Settings based on Startup Funding
Use the table below to build your hyper-targeted outreach segmentation strategy. Start with the recommendations below and work your way through the list. Before you start, please watch this video and follow the instructions to setup a country & industry scope in Prelo.
1st 2weeks – Create your country scope with two United States country configurations with focus on FinTech and HealthTech
If you do business in India, I mentioned earlier that over $5bn of funding was raised in the manufacturing and construction industry. With $5bn of the $7bn raised in India coming from a single company we’ve excluded, a manufacturing & construction from the list.
Your Prelo setup shouldn’t include Indian manufacturing & construction companies, this is not considered as a strategic outreach setup. Use the table below to optimize your Prelo configuration settings based on the most recent Startup funding updates.
| Industry | ($) Total raised | Countries |
| FinTech | $22,584,142,827 | United States |
| HealthTech | $5,840,443,653 | United States |
| Energy | $3,244,837,445 | United States |
| A.I. | Robotics | $2,383,622,094 | United States |
| Construction | Manufacturing | $1,960,306,502 | United States |
| CleanTech | $700,000,000 | India |
| E-commerce | Consumer | $583,804,810 | India |
| FinTech | $311,621,010 | India |
| Energy | $161,925,011 | India |
| HealthTech | $50,660,815 | India |
| Energy | $864,324,999 | Canada |
| HealthTech | $293,639,242 | Canada |
| Construction | Manufacturing | $247,016,047 | Canada |
| SaaS | $41,676,386 | Canada |
| FinTech | $153,337,945 | Canada |
| FinTech | $870,647,448 | Unite Kingdom |
| HealthTech | $241,649,400 | Unite Kingdom |
| E-commerce | Consumer | $234,072,447 | Unite Kingdom |
| SaaS | $79,959,339 | Unite Kingdom |
| A.I. | Robotics | $61,548,447 | Unite Kingdom |
Table 3. 0 – Startup Industries and Countries to target latest funding opportunities
Setting up your Prelo dashboard with Startup funding updates
One of the secrets to having the latest funded Startups in your Prelo dashboard, is knowing what sub-industries to add to your current Setup.
Below, I’ll share the sub-categories for each of the industries to guarantee that you’ll always have funded Startups in your Prelo dashboard.
1. FinTech
The Startups to include in your FinTech are Banking, Finance, Financial Services, FinTech, Personal Finance,
Blockchain, Ethereum, Lending Payments, Accounting and Cryptocurrency.
2. Construction & Manufacturing
Construction, Electrical Distribution, Logistics, Manufacturing, Textiles, Plastics and Rubber Manufacturing,
Building Material, Advanced Materials, Packaging Services, Paper Manufacturing, Biotechnology,
Industrial Automation, Industrial Manufacturing, Advanced Materials, Battery, Green Building,
Civil Engineering, Environmental Engineering, Industrial Engineering
3. HealthTech
Biotechnology, Therapeutics, Bioinformatics, Genetics, Life Science, Pharmaceutical,
Medical Device, Personal Health, Fitness, Clinical Trials, Health Care, Biopharma,
Medical, Nutrition, Organic, Water Purification, Wellness, Sports
4. Energy
Energy, Battery, Oil and Gas, Battery, Electric Vehicle, Energy Management, Energy Storage,
Power Grid, Recycling, Renewable Energy, Clean Energy, Sustainability, CleanTech, GreenTech,
Solar, AgTech, Energy Efficiency, Natural Resources, Environmental Engineering
5. AI & Robotics
Artificial Intelligence, Machine Learning, Analytics, Big Data, Cloud Data Services, Database
Internet of Things, Autonomous Vehicles, Data Visualization, Robotics, Text Analytics, Data Integration
Conclusion
The Startup Funding Insights shared in this blog was designed to identify countries, cities and industries most likely to respond to outreach campaigns based on their recent funding status.
This data and the tables I’ve shared will guide you to optimize your Prelo settings so that you receive a consistent stream of well–funded clients straight to your dashboard.
Remember, this blog is the quickest way to improve your outbound marketing success in the Startup funding landscape.
Tired of pitching to Startups with zero budget?
Try Prelo
💡Access to over one million qualified leads from well-funded Startups
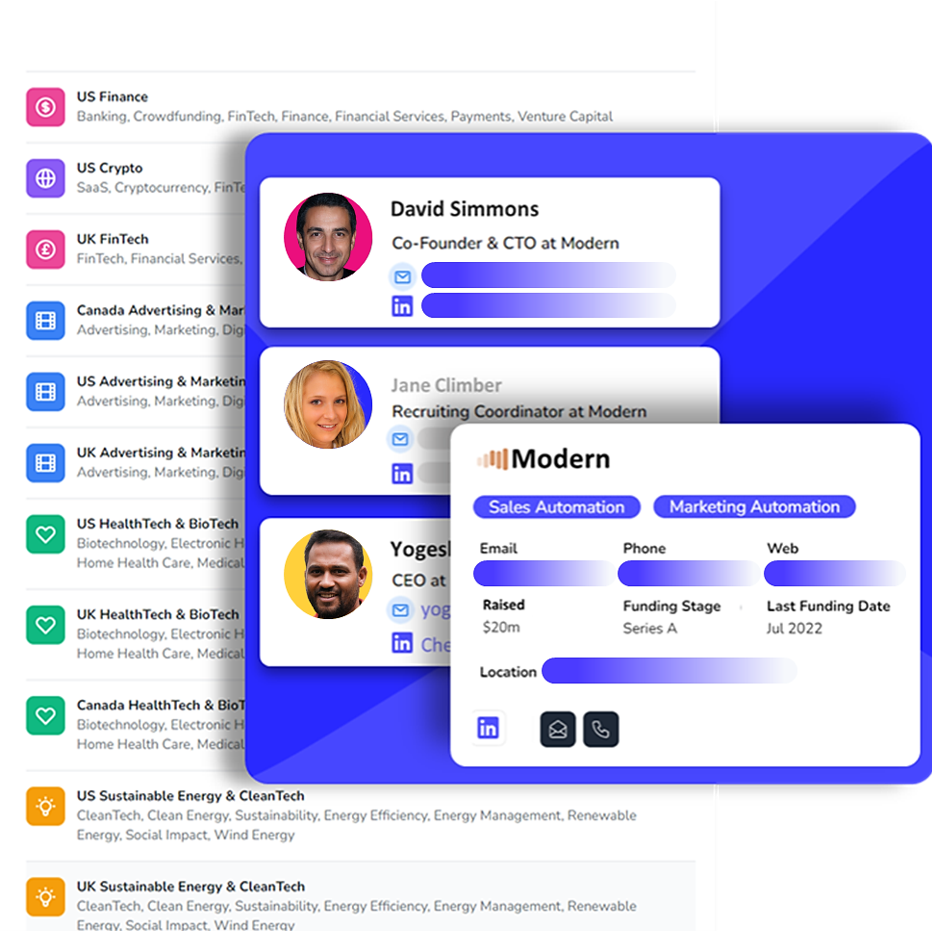
😲Discover Emails and Business Contacts of decision makers in seconds
🎯Send targeted emails to well-funded Startups and 10x your revenue